

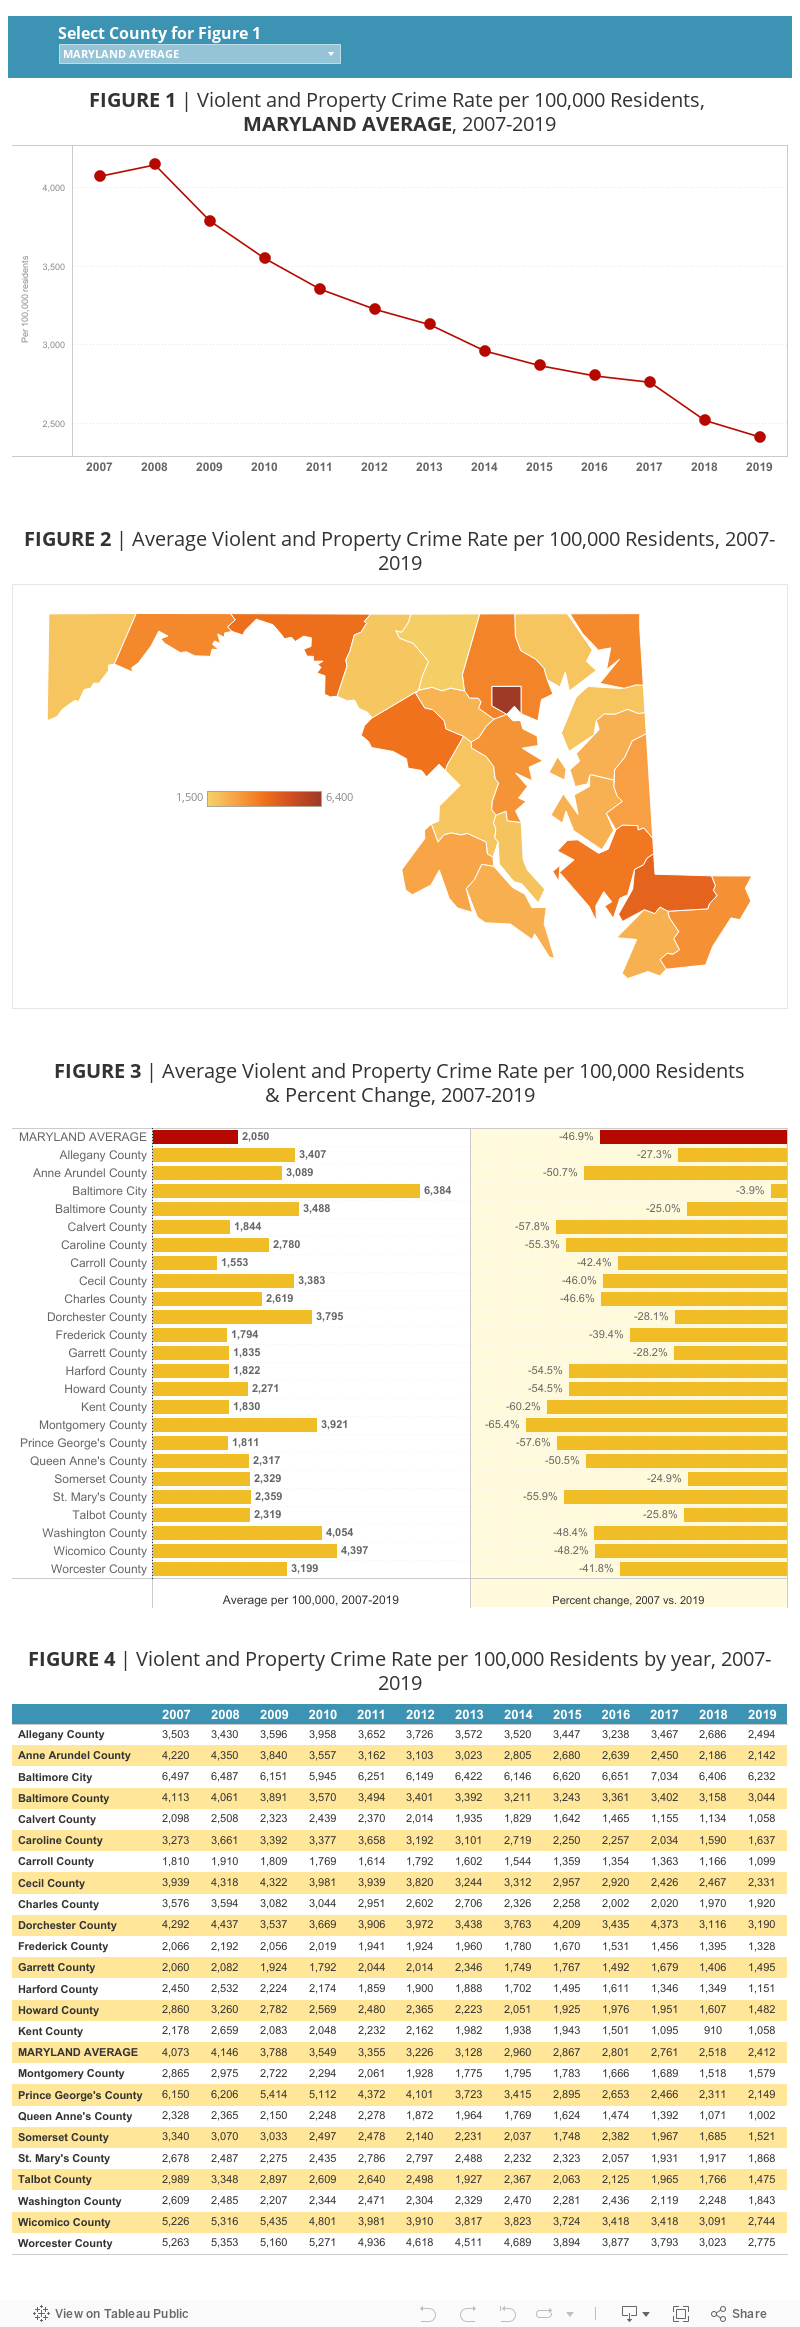
 Indicator: Violent & property crime rate per 100,000 people
- Source: MD Governor’s Office of Crime Prevention, Youth, and Victims Services, Crime Statistics
- Years included: 2007-2019
This indicator was chosen because it embraces a wide range of crimes that directly impact the relative safety of residents—including homicide, rape, aggravated assault, robbery, burglary, larceny and vehicle theft. In addition, the available data met all of the selection criteria, with the exception of disaggregation by race/ethnicity of victims.
While the lack of race/ethnicity disaggregation may obscure equity issues, this indicator was found to be the most compliant with the selection criteria of several considered.
Explore the Indicators
Click on the icons to learn more about each indicator and view the corresponding data
 |
 |
 |
 |
 |
 |
 |
 |
 |
 |
|
 |